热门版块
话题:285关注:0
话题:178关注:0
话题:166关注:0
话题:132关注:0
话题:124关注:0
话题:120关注:0
原创|使用教程|编辑:郝浩|2013-05-15 14:47:05.000|阅读 103 次
概述:UXChart虽然是WebUI Studio的图表控件,下面慧都就以一个最终用户经常提到的需求——下钻功能为例,来讲讲UXChart强大的实用性。
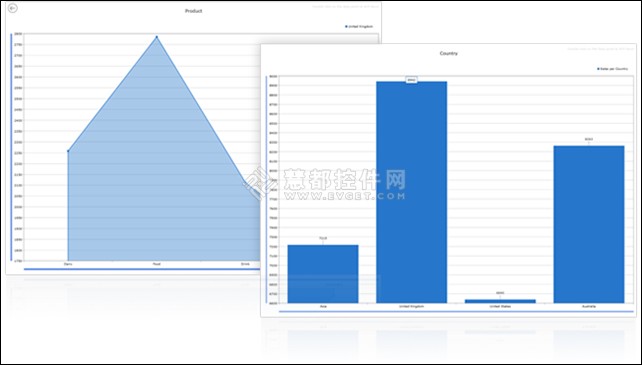
UXChart虽然是WebUI Studio今年才推出的图表控件,但以功能简约却不简单,实用性非常强而受到关注。下面慧都就以一个最终用户经常提到的需求——下钻功能为例,来讲讲UXChart强大的实用性。
向下钻取这个功能如今已经不单单在报表中流行了,一个好的图表工具一定也要具备此功能,从每年钻取到每月或从类别钻取到单个项目等等等等。UXChart能够帮助开发者快速在单个数据源中,创建无限下钻层级的图表。
用一个简单的下钻图表的例子来展示这一功能,如果需要用一个图表来说明一个主从报表,那下钻图表就是最好的选择。
创建下钻图表的步骤也非常简单,首先使用UXChart中的Child属性,来指定图表和需要展示详情的原始图表。具体来说,所有图表集合都需要被定义成视图中的第一位置。在第一次加载的时候,只能展示一个图表,其他的图表的可见性都应该被设置为折叠。详见以下代码:
<dataVisualisation:UXChart x:Name="Chart1" Visibility="Visible" Child="{Binding ElementName=Chart2}" DrillDownCommand="{Binding DrillDownCommand}"> </dataVisualisation:UXChart> <dataVisualisation:UXChart x:Name="Chart2" Visibility="Collapsed" > </dataVisualisation:UXChart> Next, we need to hook our custom command to control the drilldown action, we called it DrillDownCommand. public DelegateCommand DrillDownCommand { get; set; } And then we assign DrillDownCommand to some execute the method in our ViewModel. this.DrillDownCommand = new DelegateCommand(ExecuteDrillDown); In the execute method, we can initialize the data from the data source and retrieve detail information about the chart itself. private void ExecuteDrillDown(object parameter) { UXChartDrillDownCommandArgs args = parameter as UXChartDrillDownCommandArgs; if (args.Level == 1) { Data parent = args.DataPointContext as Data; if (parent != null) { InitializeDataByArea(parent.Area); } } }
总之,使用UXChart让创建带有向下钻取功能的图表非常简单,而且还是无限层级的,欢迎下载试用。
好文不易,鼓励一下吧!
本系列教程将为您带来LightningChart.NET中文用户手册,本篇将为您介绍手动配置Visual Studio。
在“Outline”视图或“Mind Map”视图中能展开和折叠单个或所有想法。而在Normal视图中,工具栏上的展开与折叠和“View”菜单上的“Collapse All”、“Expand All”命令工作方式相同。
Outline视图提供了一种清晰、有调理的方式来查看思想,可以让使用者快速、容易地了解思想网络的活动区域。在保持有序视图的同时,详细程度可以达到您想要的深度。
微信扫码登录
福利更多、资源更多
官方微信
官方微博
慧都科技有限公司 版权所有 Copyright 2003-2019 渝ICP备12000582号 渝公网安备 50010702500608号