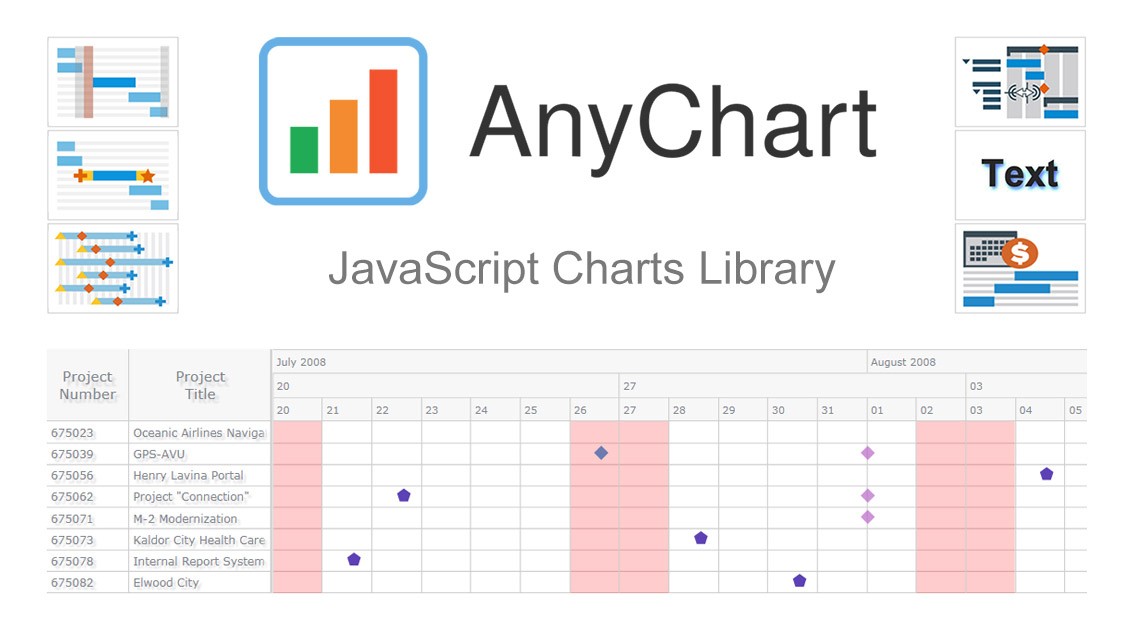
AnyChart是基于JavaScript (HTML5) 的图表控件。使用AnyChart控件,可创建跨浏览器和跨平台的交互式图表和仪表。AnyChart 图表目前已被很多知名大公司所使用,可用于仪表盘、报表、数据分析、统计学、金融等领域。
AnyChar HTML5图表高度可定制且高度兼容。拥有纯JavaScript API,AnyChart图表内置客户端数据实时更新,多层次向下钻区和具体参数更新。强大的主题引擎使你通过一系列图表进行独特的演示体验,而PDF和图像输出能产出图书质量打印文档。
AnyChart is a flexible Flash based charting solution.AnyChart enables any organization to add cross-browser and cross-platform interactive Flash charts, dashboards, graphs and maps to their applications.
准备好迎接移动革命
2015年第一季度75%的Web请求都来自移动设备。 AnyChart的JavaScript图表已经准备好迎接移动革命!JavaScript图表在大的Retina显示屏和小的智能手机上看起来都很棒,并且能在任何移动和桌面浏览器清晰详细的显示。 AnyChart的HTML5提供Internet Explorer6及以上版本、Chrome、Safari、火狐以及其他主流浏览器的桌面和移动版本的无缝用户体验。AnyChart使用SVG在兼容的Web浏览器渲染图形,Internet Explorer中的旧版通过VML支持。 AnyChart支持在 Android,iOS以及移动Windows平台的多点触摸。
本地JavaScript
AnyChart实现了通过利用本地浏览器技术而无需任何客户端插件如:Flash,Java或Silverlight。更重要的是,你可以自由选择你的服务器平台。AnyChart是纯JavaScript。
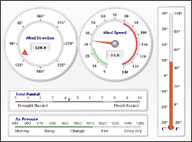
仪表和仪表盘
AnyChart的提供角度测量仪生成完美的静态或动态的仪表盘,并且这些类似测速仪的JS图表很容易被掌握。
适用于任何数据的图表
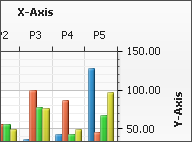
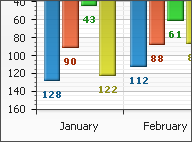
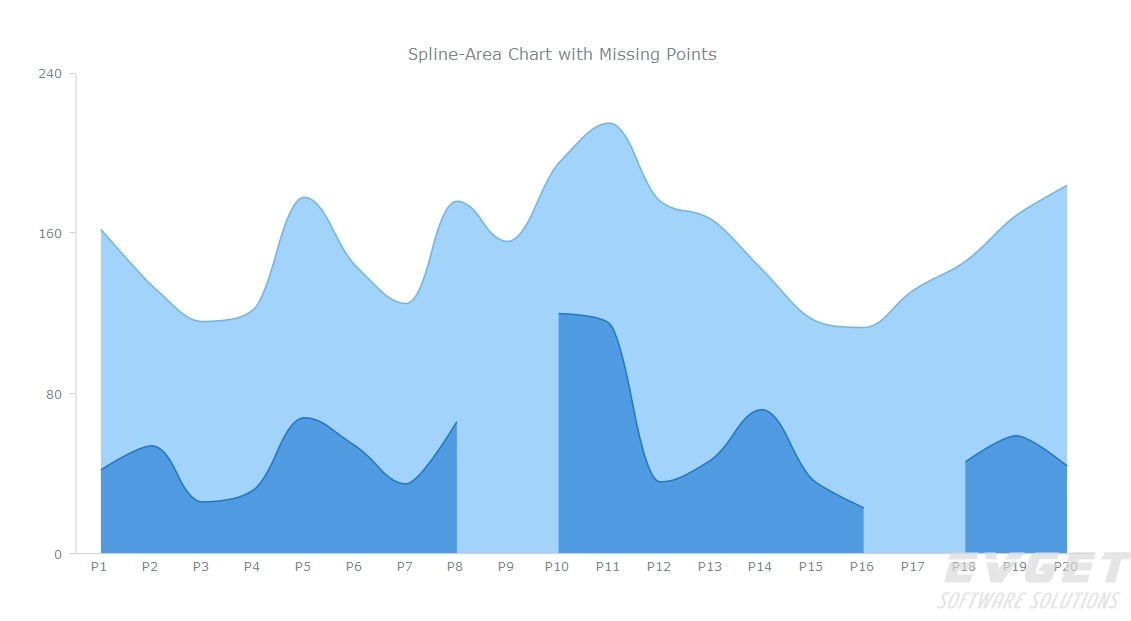
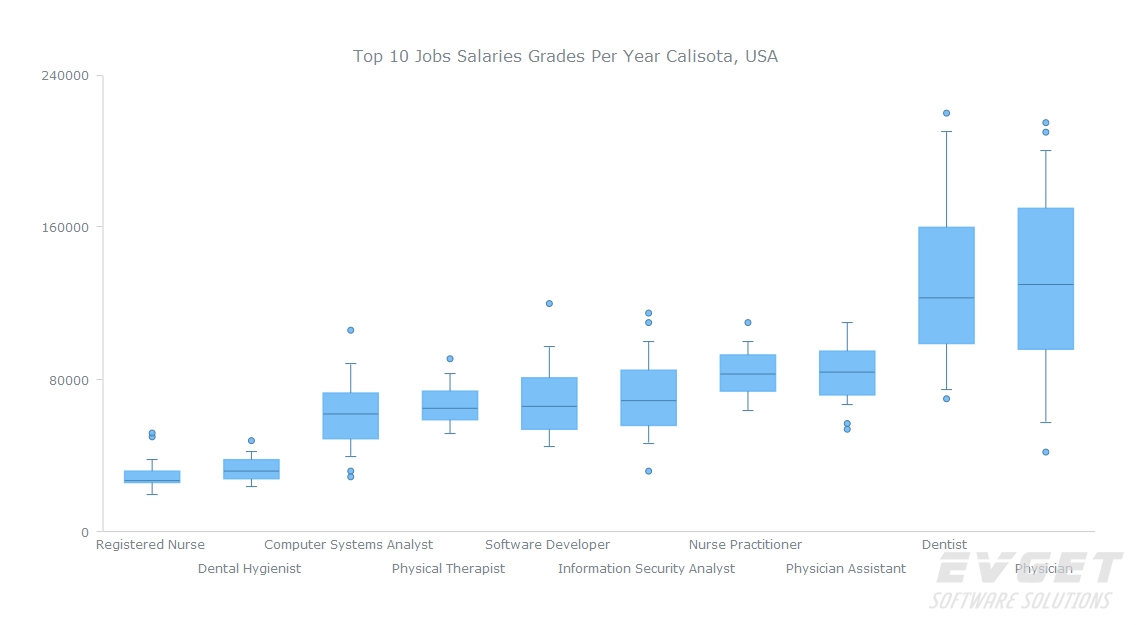
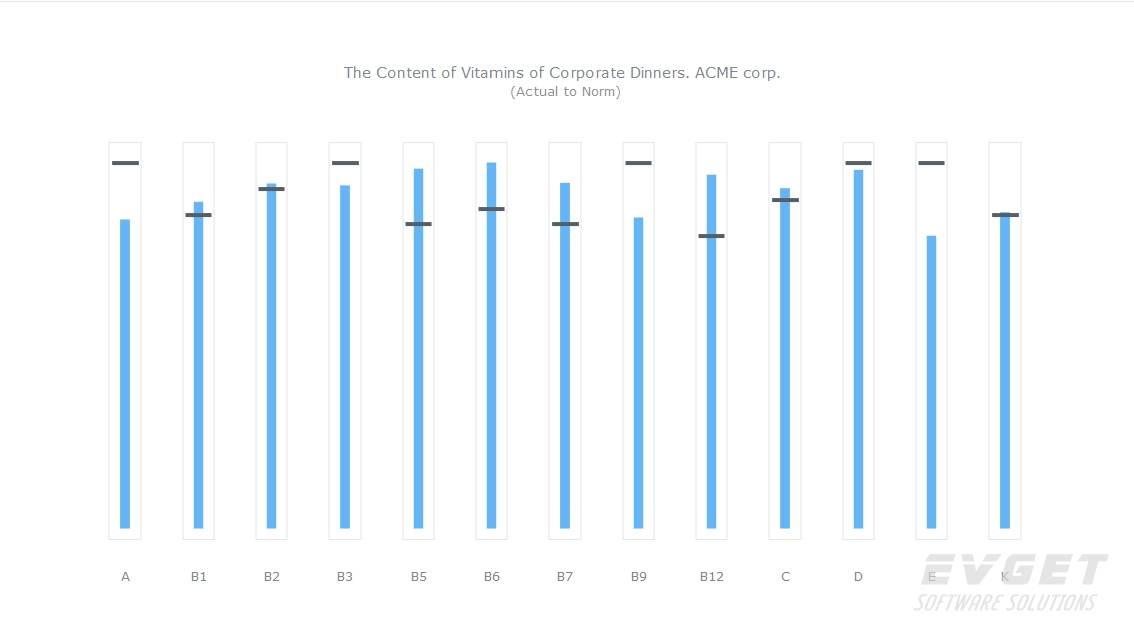
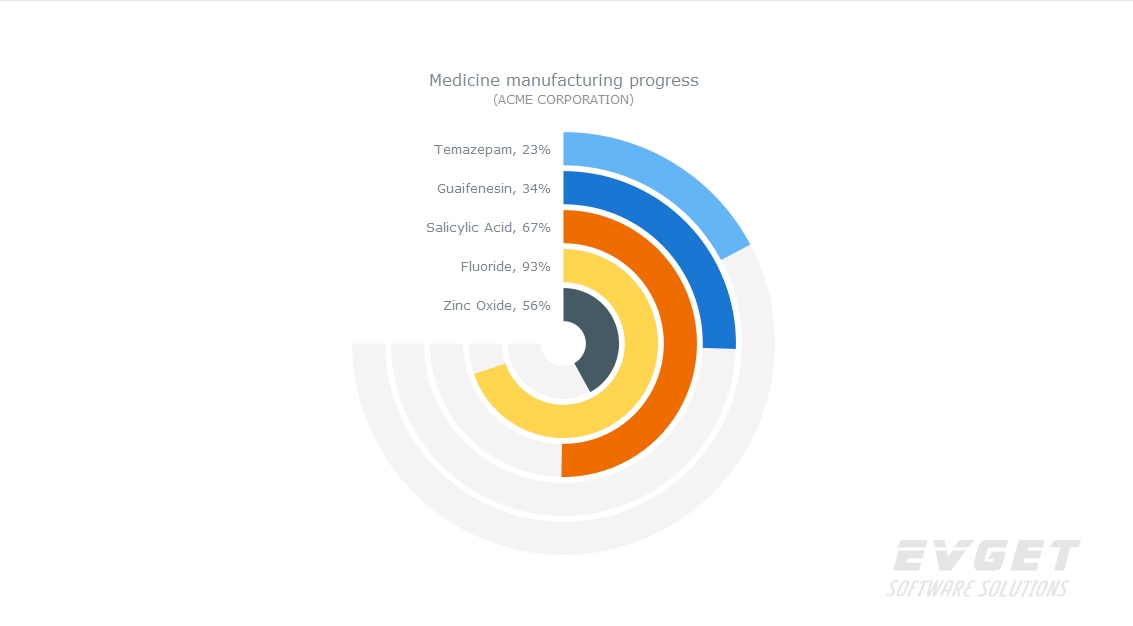
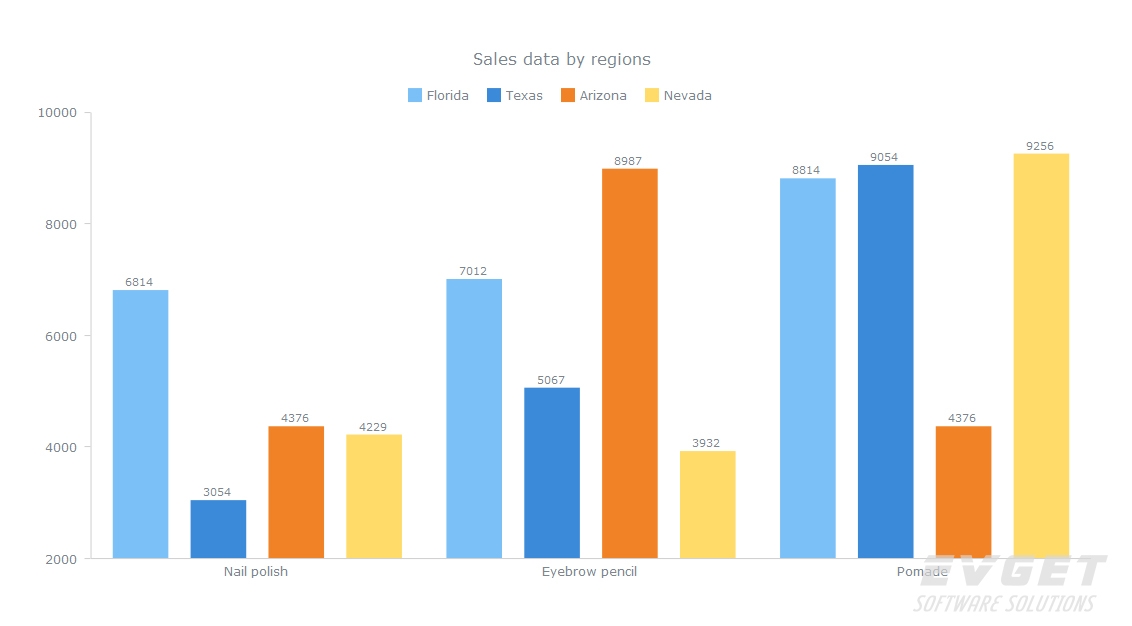
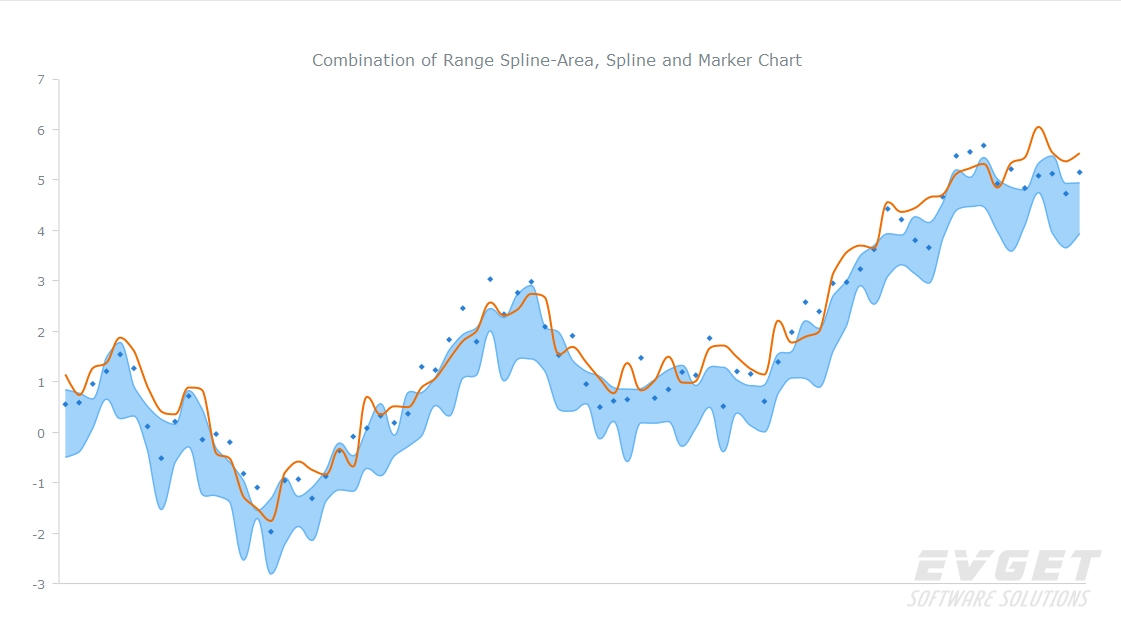
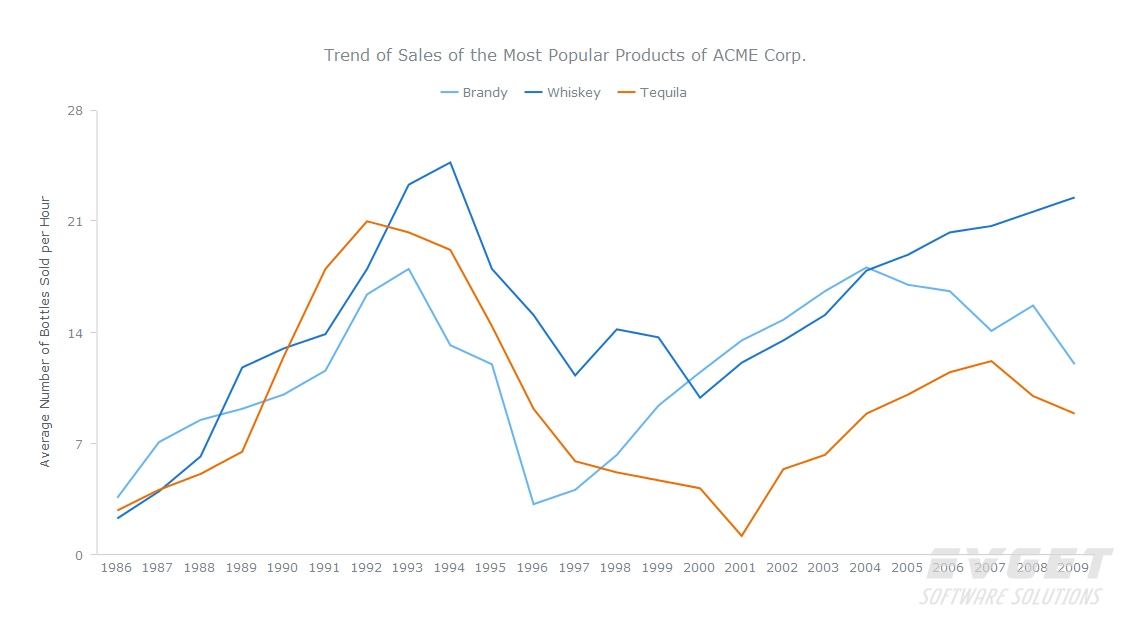
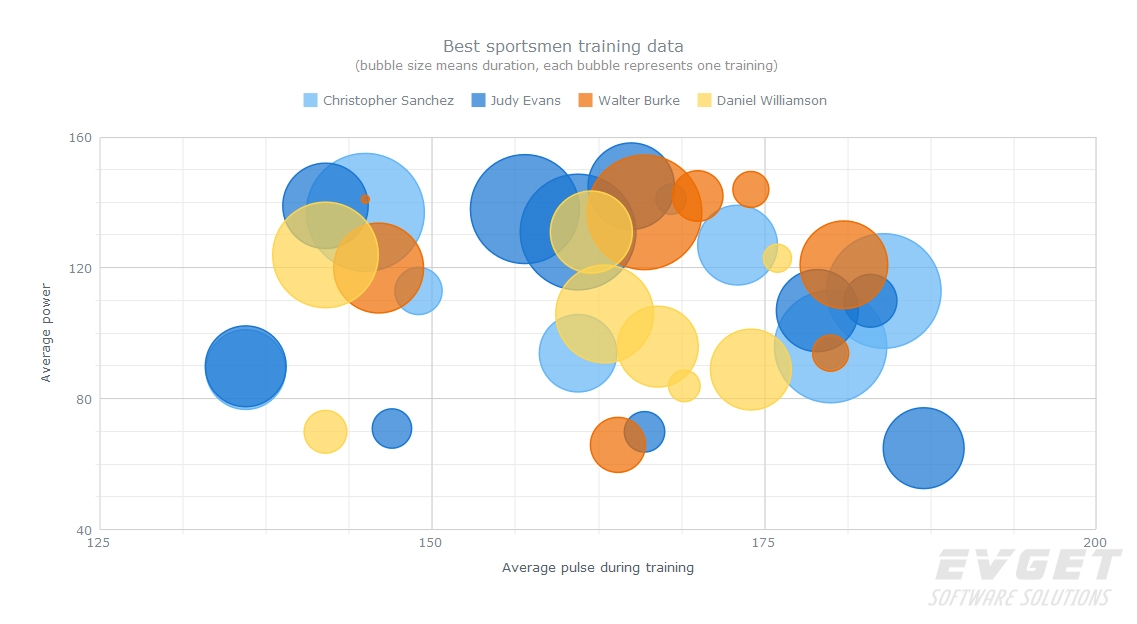
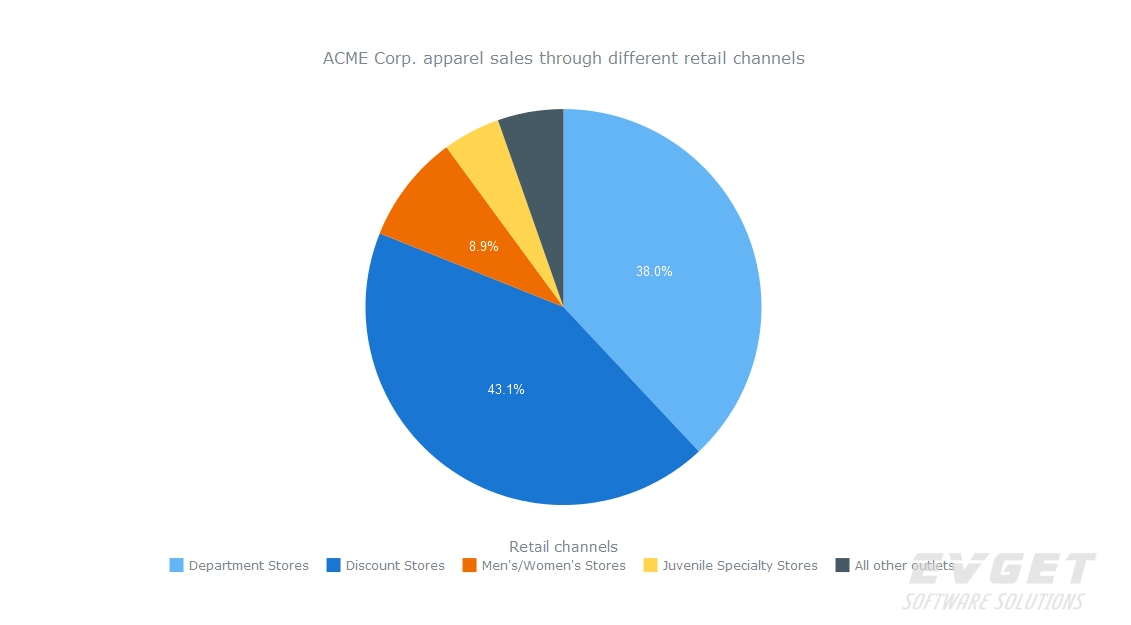
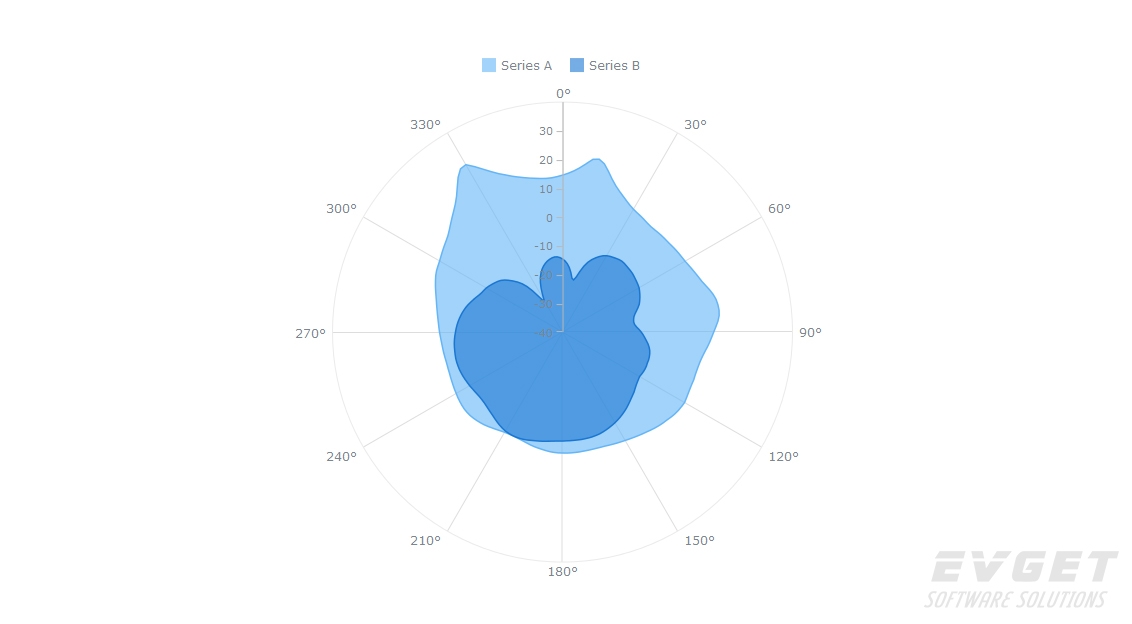
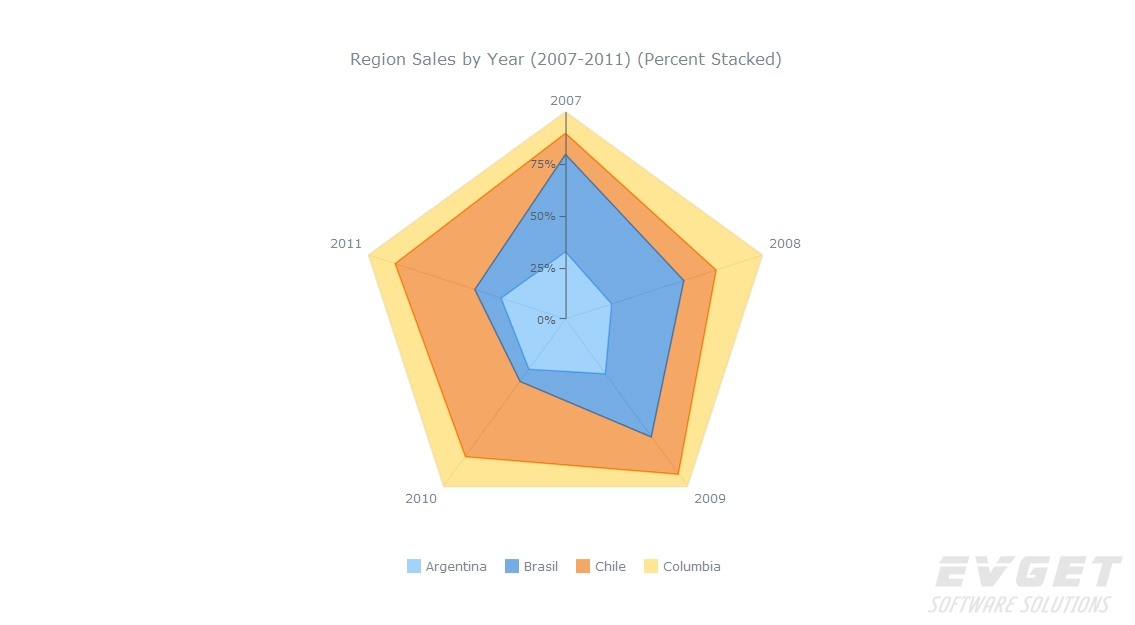
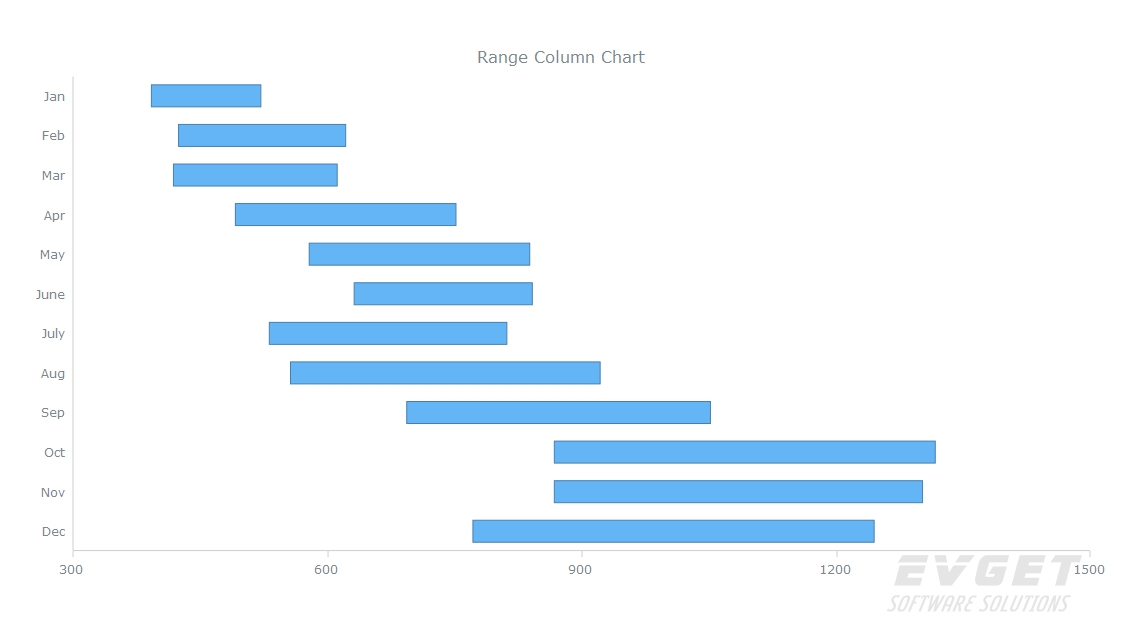
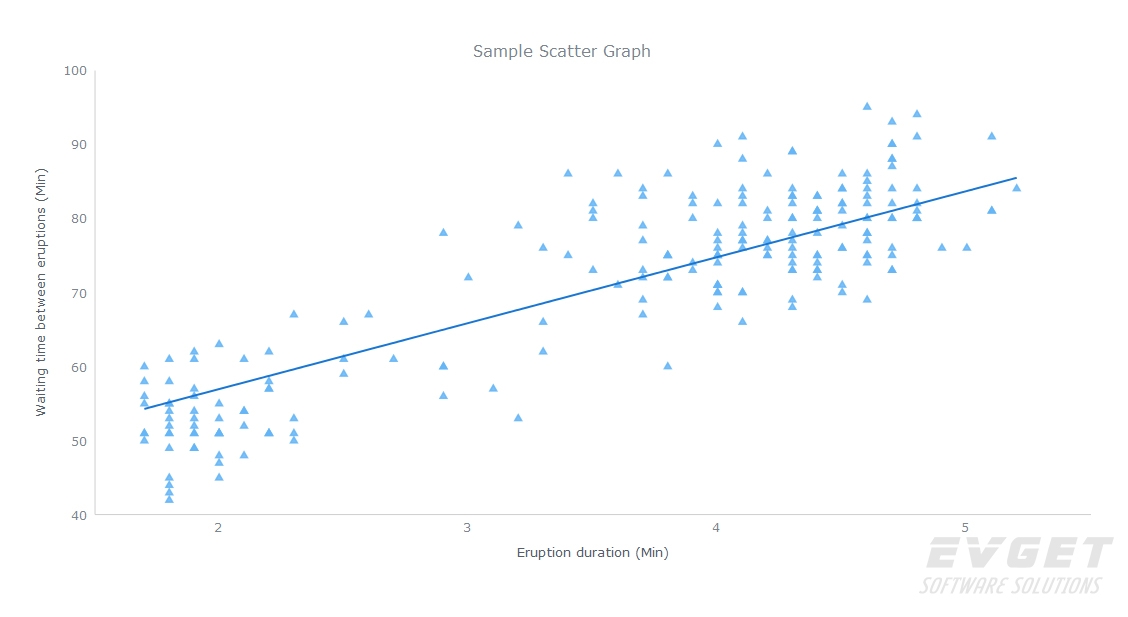
AnyChart提供众多的方式来呈现你的数据:折线图,样条曲线图,面积图,柱形图,条形图,饼图,散点图,仪表图,和极坐标图等多种图表类型可供选择。
配置简单
需要为你的图表设置自定义配置选项,但不知道怎么做? AnyChart配置无需任何开发技能,所有选项都有明确的名称并且公开为JavaScript对象符号结构。
多轴
构建代表不同类型值的图表。你不仅可以指定x和y轴的每一组数据,而且可以将每个轴放置到图表的右侧或左侧,顶部或底部。此外,还可以反转数据或指定所有轴的任何选项如:样式和单独位置。
粘性提示
AnyChart JS图表解决方案为用户提供数据详细信息的浮动提示,不仅在每个点和序列显示浮动提示,它会一直显示直到用户离开图表。AnyChart尽量使提示贴到最近的点,使其易于阅读堆积点。
智能日期和时间
日期和时间经常被用在三四个图表,这就是为什么我们特别重视如何处理日期时间轴。 AnyChart JS图表可以精确到毫秒,也可以将时间宽度设置为年或几十年。AnyChart根据数据的规模自动确定刻度线,以确保刻度线永远标记第一个月、一周的开始、午夜、正午或整点等。
打印和导出
你是否需要打印小册子或制作一个可下载的PDF格式报告?AnyChart自带在任何印刷或数字媒体完美呈现的图表的强大输出引擎。你可以将图表导出为矢量或位图图像(PNG,JPG,SVG),你可以创建一个可打印的PDF文件或简单地从网页上直接打印。
主题化和定制
只需点击几下就能更改图表的外观,为你的用户提供定制和个性化的视觉体验。你可以从众多的主题中选择,也可以自己创建独特的视觉体验。
Using AnyChart, our customers are able to maximize the value of their applications by easily adding data visualization tools that:
-
Enable better analysis and decision making by allowing comprehensive and free-flowing data exploration. This provides the ability to spot patterns and trends.
-
Increase customer satisfaction by enhancing the look of any application, report, or presentation.
-
Lower developments costs and speed time-to market.
Why AnyChart?

|
Driven by XML interface - Anychart offers you a variety of options, such as setting transparency, color, URL linking, captions and more. And you can do all these customizations via an XML File, no Flash source modifications required.
|

|
No installation - your server need not render any image, there is no need for any Active-X on the server, all graphing happens on the client side. A Flash Player is installed on more than 97% of Internet-connected PC's.
|

|
Extremely Easy to Use - you can create an XML Data Files manually or using server side scripts.
|

|
Compatible with virtually all scripting languages (ASP, PHP, ColdFusion, Perl, etc.) - Use any language you like to create XML Source and pass it to a Flash object, or simply use an XML file from your server.
|

|
Constantly growing number of supported chart types - Pie, Bar, Line, Candlestick, Area, Column, Bubble, Spline, Dot/Marker, Scatter, Candlestick, Doughnut, Circular and Linear Gauges and we will be adding new regularly.
|
AnyChart Features
|
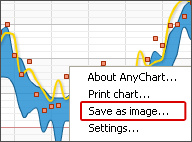
Save chart as Image
|
|
AnyChart allows to save chart as image by clicking right mouse button and selecting "Save as Image". Also this feature allows to automate server side report generation. AnyChart is the first product that supports this feature! To test this feature please visit our gallery, open any sample and click right mouse button on any chart.
|
|
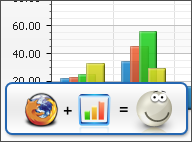
Correct printing with FireFox browser
|
|
Everybody knows that when you’re trying to get “Print preview” in Firefox some “strange” things happen: all Flash content disappears. AnyChart is the first product that solves this issue.
|
|
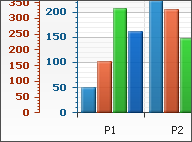
Multiple Axes
|
|
Multiple Axes feature allows to display several scales when dealing with data. Each axis can be customized using its properties to meet your needs. You can have as many axes as you want. Any data series can be linked to any axis, you can compare different series using different scales or display different scales for the same data. Any axis can be positioned and completely customized.
|
|
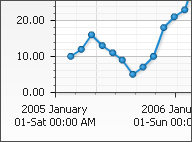
True Date/Time support
|
|
AnyChart supports date/time - it means you can operate with any date/time data without converting it. Both ordinal (categorized: bar, column, etc.) and value scales are supported. You get full control over any settings (interval, min/max control, etc). Completely customizable data input (any format of date/time data, including UNIX time stamps). This feature allows to to have use advanced formatting for axis, data labels and tooltips.
|

|
Logarithmic Scales
|
|
AnyChart can plot chart using logarithmic scales for any chart type. Both X and Y scales can be logarithmic. The base of log scale can be customized. Please note that such scales are fully configurable as usual scales. Logarithmic scales is must-have feature for all scientific and financial charts.
|
|
Axis positioning
|
|
There are full control available for axis position for any chart type and any combinations. There are 32 different combinations of axis positions available.
|
|
Axis inversion
|
|
You can invert an axis for any chart type and any combinations. Also with axis you'll get your data inverted. It works for all types of scales: usual, logarithmic, date/time. Both X and Y axis support this feature.
|
|
Interactive Gauges and Gauge Dashboards
|
|
Feature rich Gauge Engine allows creation of Editable Interactive Gauges, Composite Gauges and Gauges with real-time update.
|
Other exciting features:
-
Large Set of Chart Types - over 60 of basic chart types and we will keep this number growing.
-
Gauges - Circular, Linear (Horizontal and Linear), Bullet-Graphs, Indicators and more.
-
Uncountable Number of Chart Combinations - chart combination engine allows to plot most of chart types together.
-
Great Interactivity Options - clickable, hoverable, selectable data point, external function, AJAX support and more.
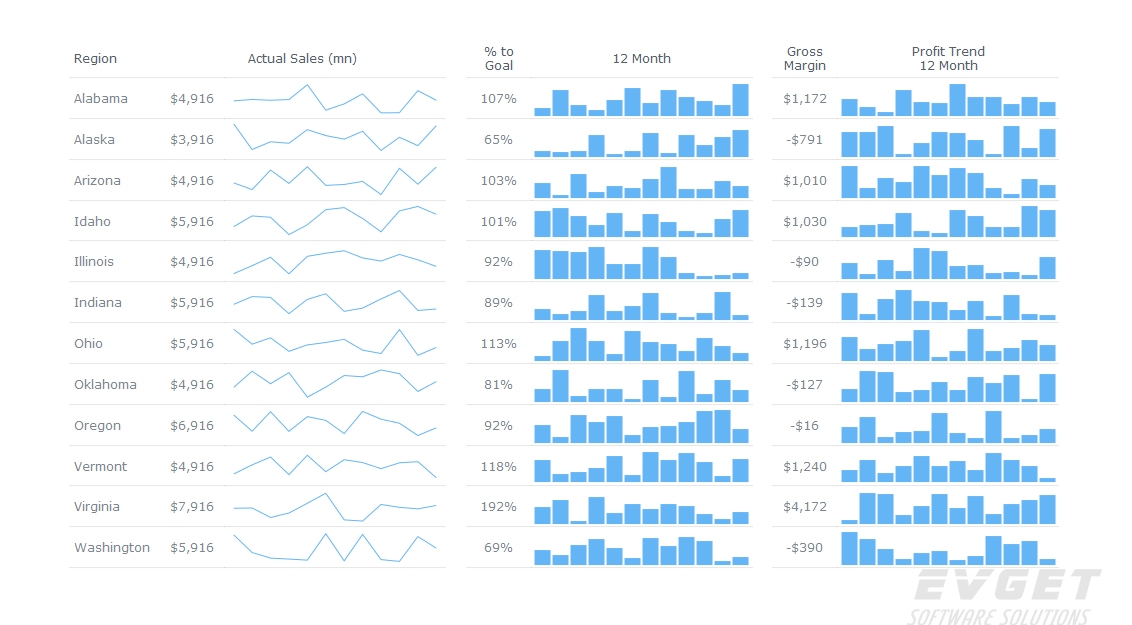
-
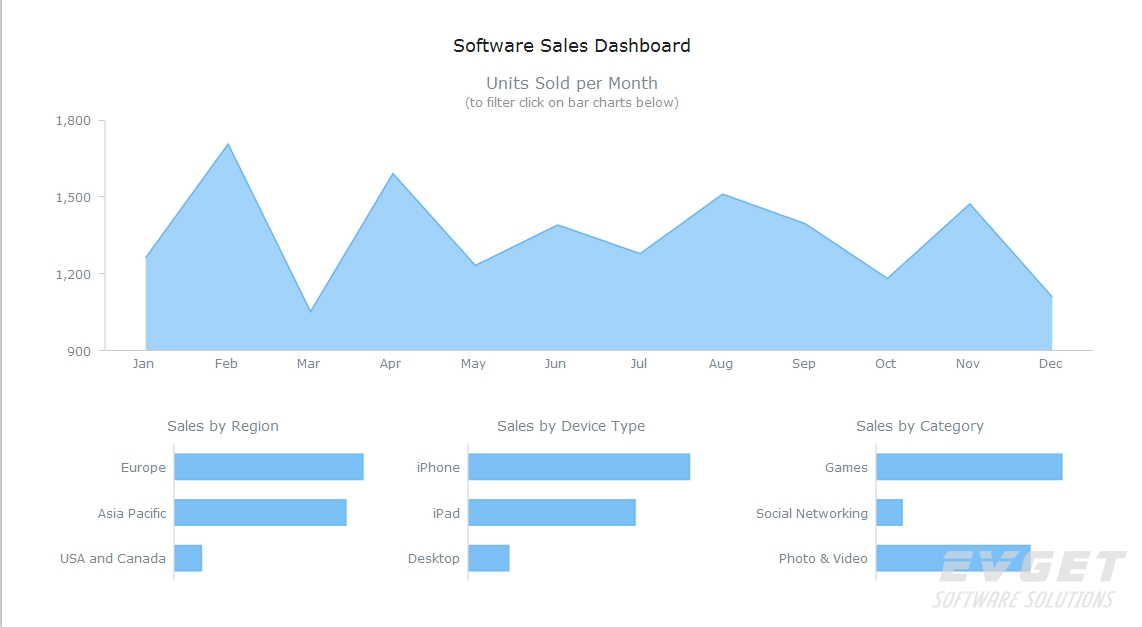
Interactive Dashboards - easy building of interactive dashboard using AnyChart Dashboard feature.
-
Axes Scaling - Axis Scaling for displaying of non-metric units and units conversion.
-
Date Time Scale - native date time scale with flexible formatting.
-
True Type Fonts Support - any language, free angle rotation and any (upon request) font.
-
Hatch Fills - for printed versions of charts.
-
Keyword Based Formatting - easy chart text configuration using a number of built-in and custom keywords.
-
Custom Data Point Attributes - attach custom fields to point or series for use in labels, tooltips, legend and actions.
-
Palettes - custom palettes, color range palettes, gradient palettes, custom hatch and marker palettes.
-
Coloring Techniques - set color with RGB, HSB, Hex Codes, HTML Constants and Color transformation functions.
-
Styles and Templates - powerful styles and templates techniques for easy chart configuration and settings reuse.
-
FireFox Printing and Printing Preview Support - no problems with printing and printing preview in FireFox.
-
Save As Image - save chart as image feature for email sending or chart export.
-
...and many more features


 首页
首页 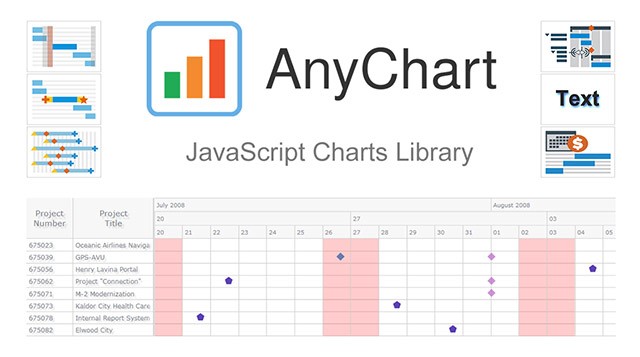


 相关产品
相关产品 授权相关问题
 微信
微信 在线咨询
在线咨询


 渝公网安备
50010702500608号
渝公网安备
50010702500608号

 客服热线
客服热线