StimulReport.Net is a .NET based report generator which helps you create flexible and feature rich reports. All reports are created in report designer with handy and user-friendly interface. You can use the report designer both in design time and in runtime. No royalties for using the report designer in runtime are required. Using StimulReport.Net you can create reports on the bases of the variety of data sources. Created reports can be used both in Windows Forms and in Asp.Net. Rendered report can be exported to: Pdf, Xml, Html, Excel, Rtf, Txt, Csv, Emf, Bmp, Jpeg, Gif, Png, and Tiff. StimulReport.Net is runtime royalty-free.
产品简介
Stimulsoft Reports.Net是一个多功能且可完全自定义的报告工具,旨在在Windows Forms应用程序中工作。在应用程序中使用Stimulsoft Reports.Net,可以创建,编辑,查看,导出和打印几乎任何复杂的报告,而只需花费很少的精力。
Stimulsoft Reports.Net的结构包括功能强大但同时又简单易用的报表设计器和交互式报表查看器。此外,该产品还包含用于ASP.NET平台的功能齐全的Web报表查看器。

查看Stimulsoft Reports.Net报价
功能亮点
常用功能
Stimulsoft Reports.Net可以使用一组真正丰富的组件以及用于对其进行自定义的许多选项来创建报告。具有RichText和HTML支持的文本和表达式,各种类型的图像,超过40种类型的图表和图形,超过30种类型的条形码,交叉表,地图,指示符等。直观的向导将简化菜单的配置。
尽管取得了成果,但不会停止并继续使用该产品的每个新版本来改进报表编写器!

yth6h94novxfzw68.png)
报表设计器
Stimulsoft Reports.Net包括具有上述特征的设计师!大家都熟悉的便捷,现代的用户界面。它支持40多种语言,用于创建报告的各种向导以及报告组件的设置-以及更多的功能,您可以立即开始创建报告。
对于Stimulsoft Reports.Net产品,报表设计器有两个版本——作为集成到使用WinForms平台的项目中的组件,以及作为现成的应用程序,用于在开发人员的计算机上创建和编辑报表。适用于Windows和macOS系统。
报告数据
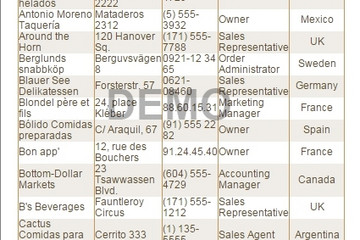
支持使用报表设计器功能和代码将数据连接到报表的多种方法。我们提供了大量受支持的数据服务器-MS SQL,Oracle,Firebird,MySQL,PostgreSQL等。我们支持ADO.NET,OData协议,多级业务对象的所有标准类型。您可以从XML,JSON,Excel和其他文件中获取数据。
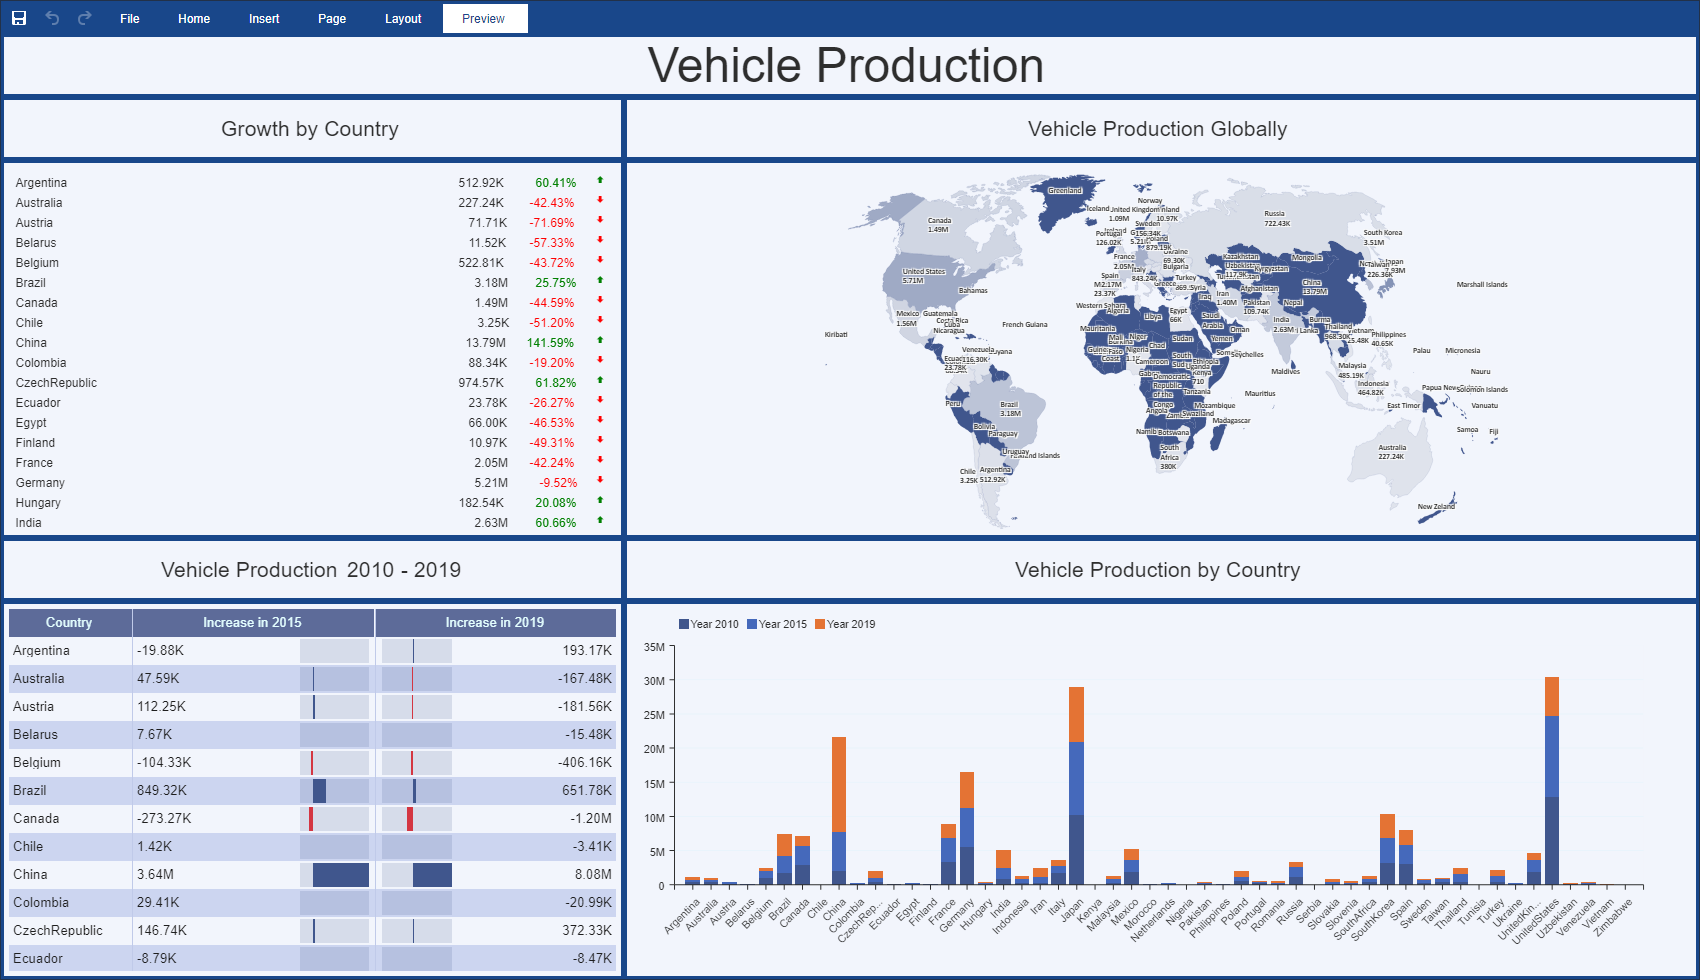
xflp2fg44aka9m9z.png)
查看报告
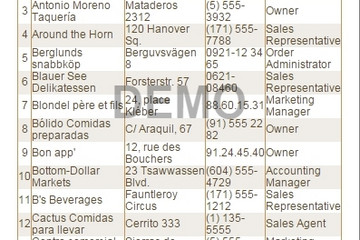
表查看器是最终用户通常使用的工具。我们的报表查看器符合以上所有条件。该组件支持多种模式,用于查看报告,搜索,打印,导出为25种以上的文件格式,使用报告参数,交互性,多层深入分析以及更多其他功能。这些功能也适用于ASP.NET的Web组件,该组件也是该产品的一部分。
集成
Stimulsoft Reports.Net旨在将报表工具的所有功能集成到WinForms项目中。使用组件,可以在应用程序中创建,编辑和查看报告。如有必要,可以使用C#/ VB.NET代码对报表执行任何操作。为了更紧密地集成,两个组件以及报表编写器本身都有许多属性和事件。提供了用于在ASP.NET应用程序中查看报告的功能齐全的组件。

报表工具对比
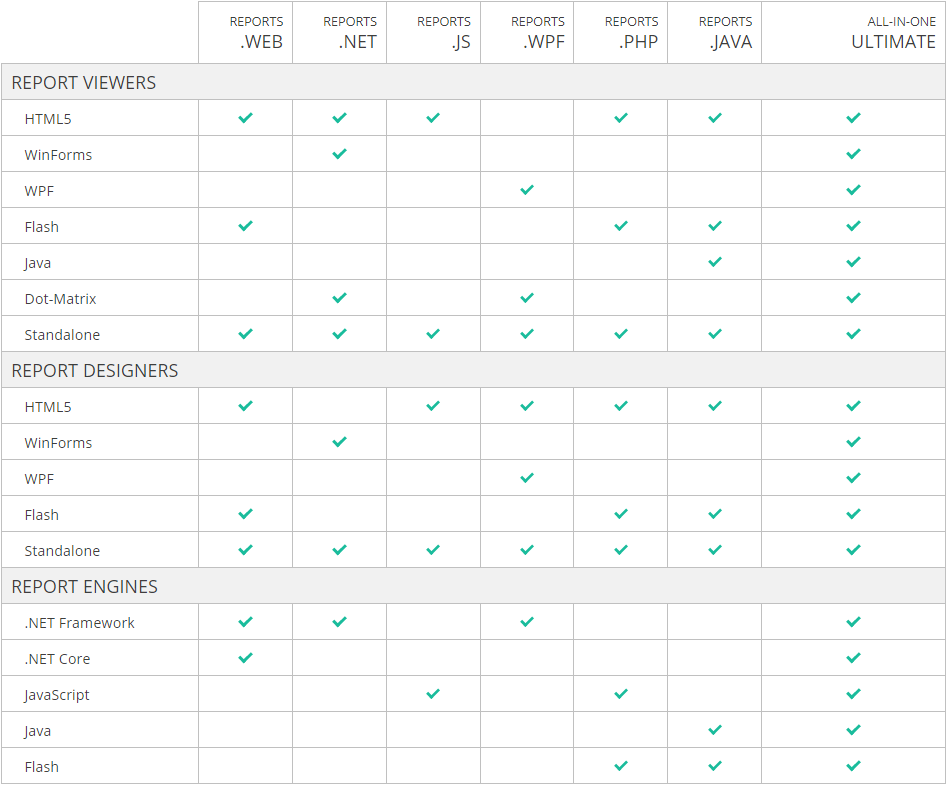
仪表盘工具对比
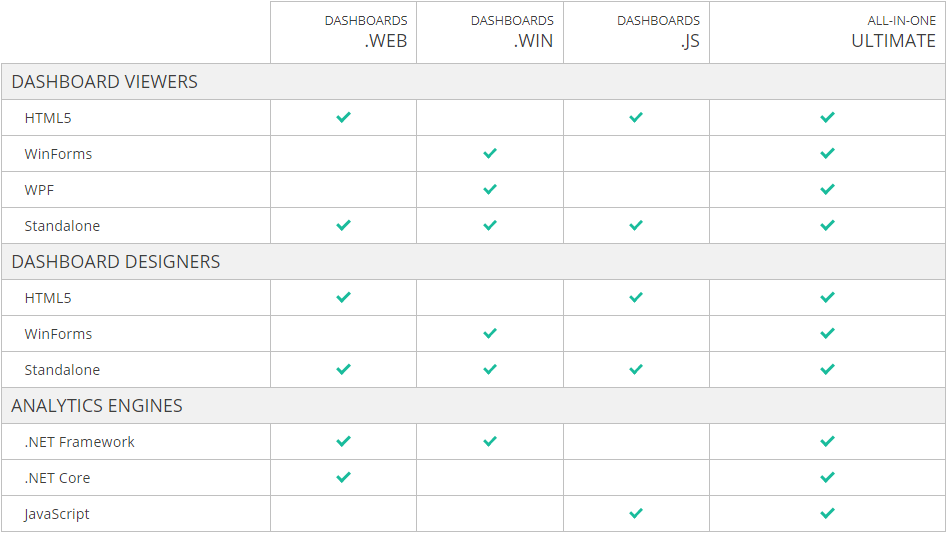

Report creation
Handy separation the report template into pages
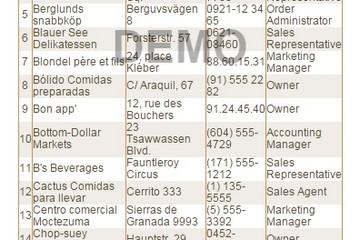
Handy visual separation of the report template into pages is available in StimulReport.Net. You visually put all data which you want to output on a page. You can output both bound data and independent data. Such a separation allows you to make reports creation faster and allows you to increase visual perception of the report.
Data sorting, grouping, filtration with report engine
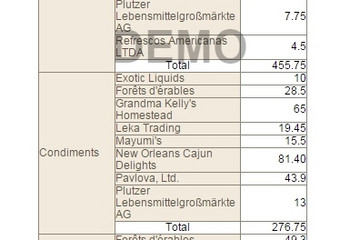
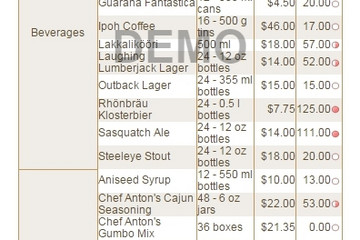
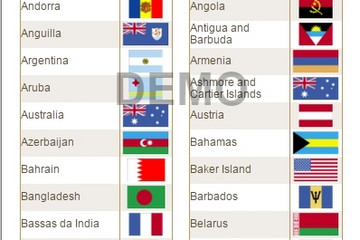
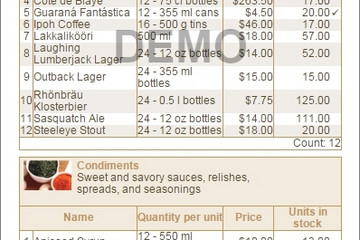
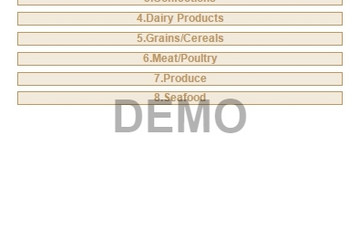
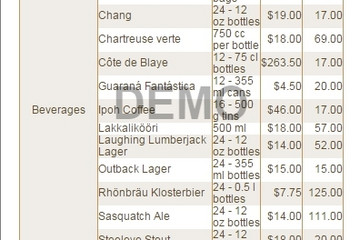
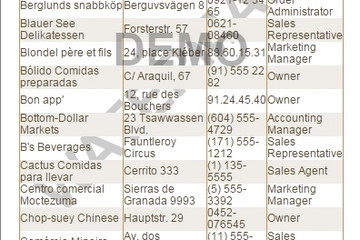
You can output both one list of data and many independent lists. Data can be grouped, sorted, filtered, and logically bound. All this can be done with report generator facilities. And there are no limitations.
Unlimited hierarchical reports
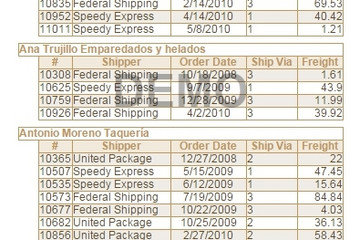
Using StimulReport.Net there are no problems with creation of Master-Detail reports. Therefore, there is no need to use sub-reports. You may create such reports quickly and visually. Number of nesting levels of Master-Detail reports is unlimited.
Unlimited multicolumn reports
There is no difficulty to create reports with columns. Three modes of columns output are available. Columns can be output both on a page and on band. Modes of columns output can be combined and applied concurrently. Number of columns in reports is unlimited.
Reports with grouping
StimulReport.Net is able to group data with use of both simple and complicated conditions. It is accepted multiple nesting of one group into another. The number of groupings in one report is unlimited.
Charts
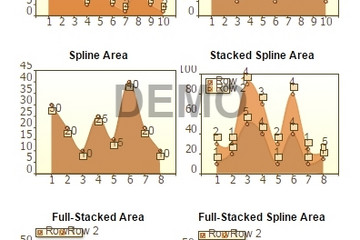
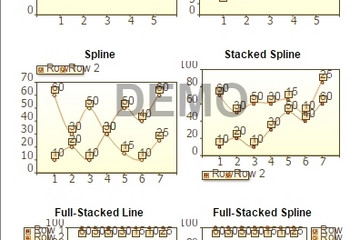
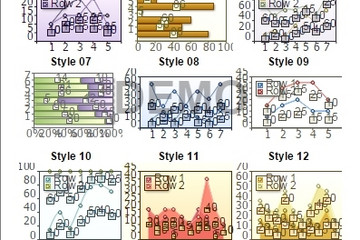
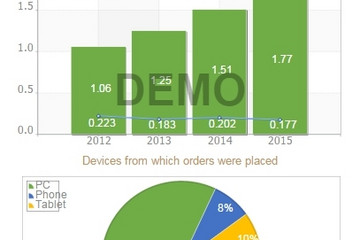
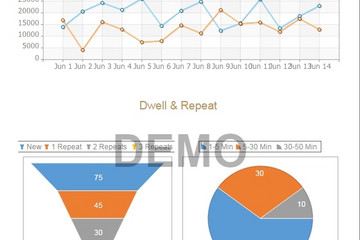
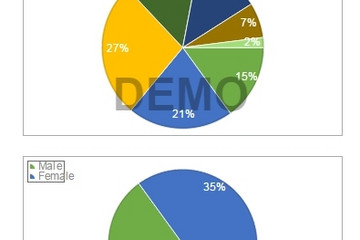
Comprehensive set of charts designed to increase graphical impact of reports is available in StimulReport.Net. The following types of charts are supported: Clustered Column, ClusteredBar, Area, Pie, Doughnut, Line, Spline, Spline Area, Stacked Bar, Stacked Column, Stacked Area, Stacked Line, Stacked Spline, Stacked Spline Area, Full-Stacked Column, Full-Stacked Bar, Full-Stacked Area, Full-Stacked Line, Full-Stacked Spline, Full-Stacked Spline Area. The best chart style is based upon your data. Charts are automatically updated when new variables are added.
Unique ability - containers
Containers in StimulReport.Net are the unique ability of our product. Using containers the report creation like Side by Side is getting a deal of some minutes. The number of containers in the report is unlimited.
Unique ability - segmented pages
Unique ability to create reports with use of some pages by the width or height, simplicity of giving information for the user is available in StimulReport.Net.
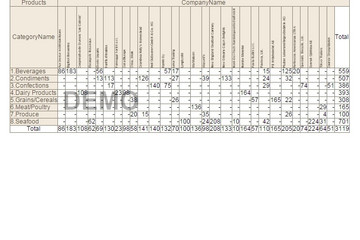
Simple way to cross reports
Complete set of tools for rendering both simple and compound cross-reports.
Dialog forms for parameters of the report output
Unique decision is the ability to create dialog forms in the report for parameters input. For forms creation many controls are given.
Powerful system of calculation of totals
You can calculate total of a report, group, column, page, with growing total, with condition. Following aggregate functions are available: Sum, Count, Avg, Max, Min, First and Last. All you need to do for calculation of totals is to write the following expression in the text component: {Count()}. And it is not necessary to put this component on the Footer bands. Totals can be output in any part of a report. And all this is without writing any code.
Report designer
The report designer is available in runtime
The report designer is available in runtime and has no limitations. You can build-in the ability to edit reports in your program. You can do this without difficulties.
User-friendly interface
The report designer has a professional and usable interface. Docking windows, toolbars, hotkeys are used etc.
Easy setup for different tasks
You can setup the view of the report designer. It is possible to turn on/off any element of the menu, any button on toolbars, any docking window and many other elements. This allows you to simplify usage of the Designer by the end-user.
Text editing on a page
It is very convenient to edit the text directly on a page without additional windows calling or changing properties in the PropertyGrid.
Preview in report designer
Clicking the special bookmark in the report designer you can see the result of your report creation.
Zoom
The report designer allows you to edit reports in any zoom. This gives you ability to view the page on the whole and display any part of the report page.
Full localization
The report designer is fully translated into many languages. The number of languages on which StimulReport.Net speaks permanently increases.

 首页
首页 

 便捷报表工具


yth6h94novxfzw68.png)

xflp2fg44aka9m9z.png)





 实时了解产品最新动态与应用


 相关产品
相关产品 授权相关问题
 在线咨询
在线咨询




 渝公网安备
50010702500608号

 客服热线
客服热线