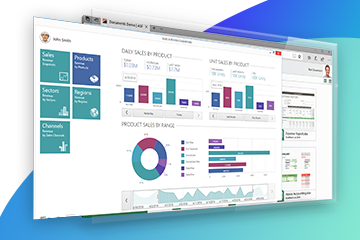
Stimulsoft Ultimate是用于创建报表和仪表板的通用工具集。该产品包括用于WinForms、ASP.NET、.NET Core、JavaScript、WPF、PHP、Java和其他环境的完整工具集。
Stimulsoft Reports不仅拥有强大的报表导出系统,而且还支持多种报表导出格式,拥有简单且强大的报表引擎。Stimulsoft Reports基本原则是,用简单常规的方法创建报表,将不同的技术应用于应用程序。Stimulsoft Reports .NET一个基于.NET框架的报表生成器,能够帮助你创建结构、功能丰富的报表。不仅界面友好,而且使用便捷,能够让你轻松创建所有报表。
点击下载Stimulsoft Reports .NET v2021.3.1最新版
此示例显示如何从代码打印数据网格。数据网格是以表格形式呈现的数据。在Form1_Load()事件中创建并填充数据集合:
private void Form1_Load(object sender, System.EventArgs e)
{
	DataTable table = new DataTable("Demo");

	table.Columns.Add();
	table.Columns.Add();

	DataRow row1 = table.NewRow();
	DataRow row2 = table.NewRow();
	DataRow row3 = table.NewRow();

	row1.ItemArray = new string[2]{"1", "One"};
	row2.ItemArray = new string[2]{"2", "Two"};
	row3.ItemArray = new string[2]{"3", "Three"};

	table.Rows.Add(row1);
	table.Rows.Add(row2);
	table.Rows.Add(row3);
	dataView1.Table = table;
}
让我们分PrintDataGrid()部分更详细地看一下该方法。首先,在字典中新建一个报表和数据源:
private void PrintDataGrid(DataGrid sender)
{
	DataView dataView = (DataView)sender.DataSource;
	StiReport report = new StiReport();
	report.ScriptLanguage = StiReportLanguageType.CSharp;

	// Add data to datastore
	report.RegData("view", dataView);

	// Fill dictionary
	report.Dictionary.Synchronize();

...
接下来,在报告中添加一个 Data Band 和 Header Band:
...

	StiPage page = report.Pages.Items[0];

	// Create HeaderBand
	StiHeaderBand headerBand = new StiHeaderBand();
	headerBand.Height = 0.5f;
	headerBand.Name = "HeaderBand";
	page.Components.Add(headerBand);

	// Create DataBand
	StiDataBand dataBand = new StiDataBand();
	dataBand.DataSourceName = "view" + dataView.Table.TableName;
	dataBand.Height = 0.5f;
	dataBand.Name = "DataBand";
	page.Components.Add(dataBand);

...
接下来,将参考数据源字段的文本框放置在数据带上,并在标题带上放置带有数据标题的文本框:
...

	// Create texts
	Double pos = 0;
	Double columnWidth = StiAlignValue.AlignToMinGrid(page.Width / dataView.Table.Columns.Count, 0.1, true);
	int nameIndex = 1;
	foreach (DataColumn column in dataView.Table.Columns)
	{
		// Create text on header
		StiText headerText = new StiText(new RectangleD(pos, 0, columnWidth, 0.5f));
		headerText.Text.Value = column.Caption;
		headerText.HorAlignment = StiTextHorAlignment.Center;
		headerText.Name = "HeaderText" + nameIndex.ToString();
		headerText.Brush = new StiSolidBrush(Color.LightGreen);
		headerText.Border.Side = StiBorderSides.All;
		headerBand.Components.Add(headerText);

		// Create text on Data Band
		StiText dataText = new StiText(new RectangleD(pos, 0, columnWidth, 0.5f));
		dataText.Text.Value = "{view" + dataView.Table.TableName + "." +
			Stimulsoft.Report.CodeDom.StiCodeDomSerializator.ReplaceSymbols(column.ColumnName) + "}";
		dataText.Name = "DataText" + nameIndex.ToString();
		dataText.Border.Side = StiBorderSides.All;

		// Add highlight
		StiCondition condition = new StiCondition();
		condition.BackColor = Color.CornflowerBlue;
		condition.TextColor = Color.Black;
		condition.Expression = "(Line & 1) == 1";
		condition.Item = StiFilterItem.Expression;
		dataText.Conditions.Add(condition);

		dataBand.Components.Add(dataText);

		pos += columnWidth;

		nameIndex ++;
	}

...
然后,将带有文本框的页脚带添加到报告中以显示总计值:
...

	// Create FooterBand
	StiFooterBand footerBand = new StiFooterBand();
	footerBand.Height = 0.5f;
	footerBand.Name = "FooterBand";
	page.Components.Add(footerBand);

	// Create text on footer
	StiText footerText = new StiText(new RectangleD(0, 0, page.Width, 0.5f));
	footerText.Text.Value = "Count - {Count()}";
	footerText.HorAlignment = StiTextHorAlignment.Right;
	footerText.Name = "FooterText";
	footerText.Brush = new StiSolidBrush(Color.LightGreen);
	footerBand.Components.Add(footerText);

...
最后,渲染报告并在查看器中显示:
...

	// Render without progress bar
	report.Render(false);
	report.Show();
}
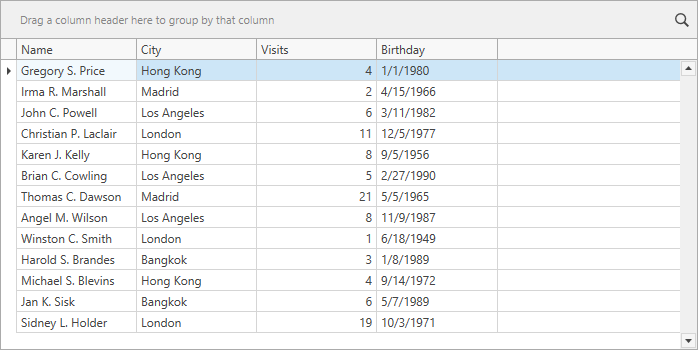
在下面的屏幕截图中,您可以看到示例代码的结果:

Aspose、E-iceblue、FastReport、Stimulsoft等文档/报表图表类开发工具享超低折扣,如有需要可直接联系在线客服。
标签:
本站文章除注明转载外,均为本站原创或翻译。欢迎任何形式的转载,但请务必注明出处、不得修改原文相关链接,如果存在内容上的异议请邮件反馈至chenjj@evget.com


 首页
首页 


 11次
11次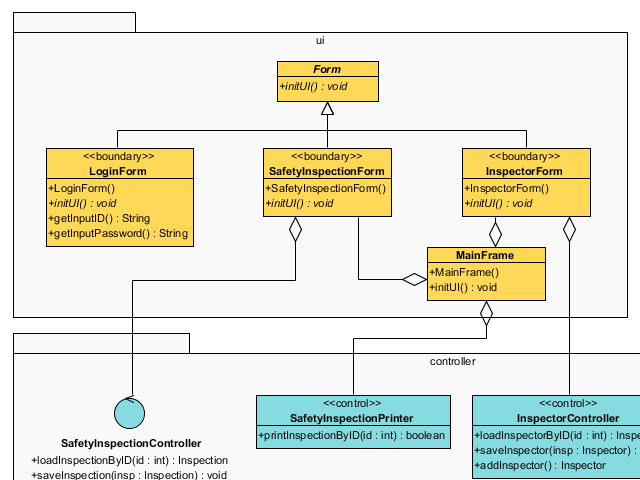
 相关产品
相关产品 最新文章
最新文章 
 相关文章
相关文章 

 微信
微信 在线咨询
在线咨询


 渝公网安备
50010702500608号
渝公网安备
50010702500608号

 客服热线
客服热线